|
The FGL Debugger is an integrated part of the freely provided FifthGen Engine and is
used to provide real-time debugging of standalone and web-based applications. The debugger
is invoked automatically in the event of error, provided it has been enabled as part of
the default system configuration, or manually upon hitting a preset break-point or upon
encountering an embedded debugbreak( ) command.
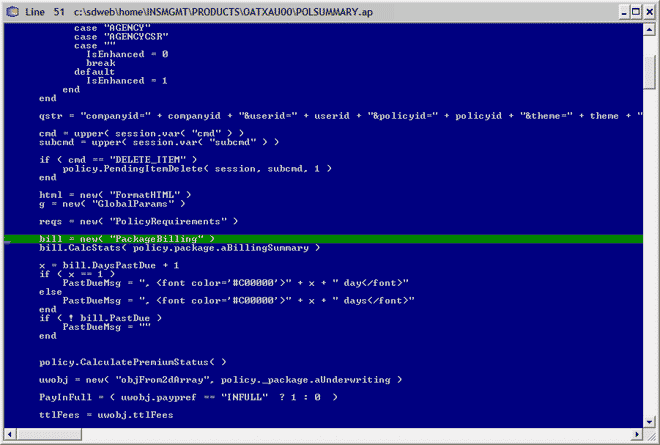
Once a debug event has triggered, the debugger will display the appropriate source code
in the display window and highlight the appropriate line of code. If the event was triggered
by an error, then detailed information identifying the error is also displayed.
Debugging Help
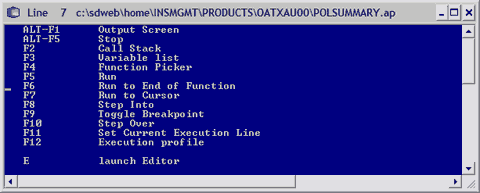
Hitting F1 from within the debugger displays the help summary screen that references the
available command options.
Debugging Variables
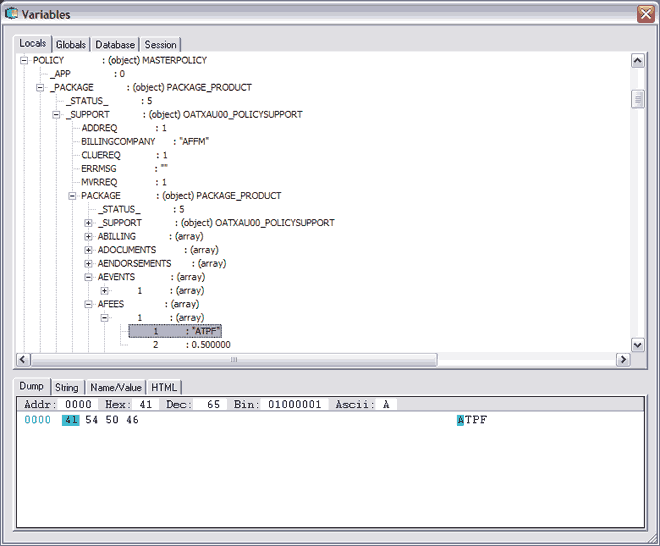
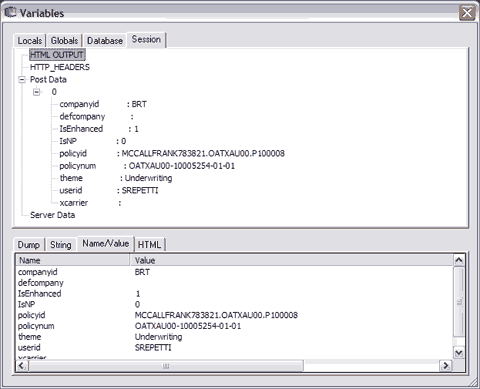
Variables can be examined at any time by hitting the F3 button within the debugger. Local
variables, globals, active database connections, and server/session data can be interrogated
in real-time. Even complex objects, nested structures, and multi-dimensional arrays can be
examined in detail.
Various views for inspecting real-time data are provided, including ASCII/HEX dump, string
data, name/value pair information, and rendered HTML view.
Debugging Databases
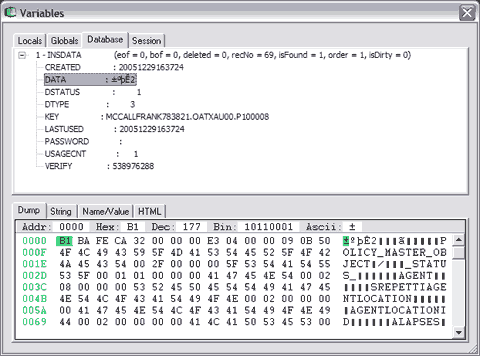
Active database connections and their current records can also be interrogated. Each
instance of an open database connection is presented with connection details identifying
end-of-file, beginning-of-file, deleted, and IsDirty states, as well as the current record
number, active index ordinal reference, and the results of the most recent find/seek
operation.
Current record information for each open database can be further examined through the
debugger and the individual record structure with current field names and values are
presented for inspection. Complex packed object (and other) data housed in referential
BLOBs can be examined and extracted in real-time.
Debugging Server/Session Data
Overall server and session data is also available for interrogation through the debugger.
Session data shows all of the current GET/POST data passed to the corresponding Active Page
at the time the debugger was invoked. Raw server HTTP headers can also be inspected. Form and
other session data can be viewed in name/value format.
Debugging Functions
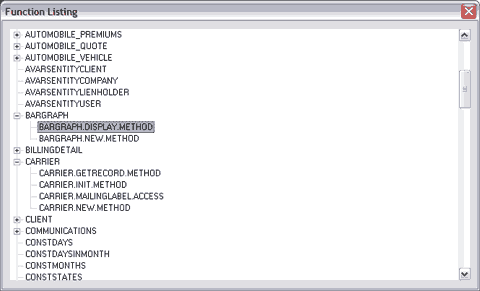
The F4 key invokes the class and function picker displaying all functions, classes, and
methods available to the current debugging environment, including active content and
associated libraries. You can quickly jump to individual functions and classes simply by
highlighting them in the pick window and double clicking the mouse. The appropriate source
file will be automatically loaded and the corresponding source code presented for review.
Additional advanced debugging functionality is also available within the debugger,
including call stack, step in/over/to end of function/to cursor and even the ability to
arbitrarily set the current debugging execution line, among other features.
See also:
Compiler | Linker | Librarian | Console | Debugger | Profiler | Project | Editor | IDE
#####
|