|
The FGL profiler is part of the freely provided FifthGen Engine and is used to analyze
execution performance of dynamic content (Active Pages) in a real-time server environment.
It is invoked directly from the FifthGen Engine tray icon by selecting the appropriate
enable/disable profiler from the menu.

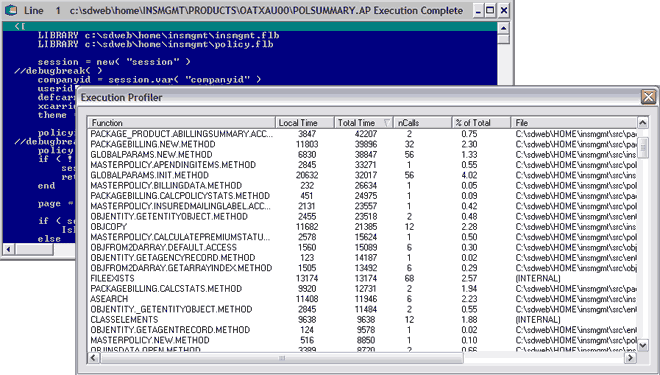
When the profiler is enabled, the real-time FGL debugger is automatically invoked after
displaying each page containing dynamic FGL content. From the debugger, press the F12 key to
display the profile analysis window. This identifies all of the processes and routines that
were called to render and display the page. Click the title headers to toggle sorting based
on the selected columns. Profiling information includes function name, source file, number
of calls, total execution time, and percentage of time for the overall rendering.
Cumulatively, this information can help determine where to best focus your efforts in the
process of optimizing your source code.
See also:
Compiler | Linker | Librarian | Console | Debugger | Profiler | Project | Editor | IDE
#####
|